You swap python for python3.14t, run the four-thread benchmark that has been sitting in the repo since the no-GIL argument started, and watch it finish in a fraction of the time. You ship it. Throughput on the actual service moves by a couple of percent, and p99 gets slightly worse.
Nothing malfunctioned. The benchmark measured exactly what you told it to. It just answered a question nobody was asking.
There are three interpreters here, not two
Framing this as “GIL versus no GIL” hides a third configuration, and that one is where the confusion lives:
python3.14— the default build. GIL on, no free-threading machinery compiled in.python3.14t -X gil=1— the free-threaded build with the GIL turned back on.python3.14t -X gil=0— the free-threaded build doing what it was built for.
The t suffix is the convention, but the names around it are not: “Whether python, python3 and/or python3.14 point at the free-threaded executable depends on the installation method used.” Which is the first reason a benchmark should check what it is running rather than trust the name it was invoked by.
That middle configuration is not a curiosity; the switch is documented: “-X gil=0,1 forces the GIL to be disabled or enabled, respectively. Setting to 0 is only available in builds configured with --disable-gil.” Which makes it useful for bisecting a compatibility problem without rebuilding.
Three configurations give you three possible comparisons, and each answers a different question:
| Comparison | What it isolates | What it tells you |
|---|---|---|
3.14 → 3.14t -X gil=1 |
the free-threading tax | what you pay before a single thread scales |
3.14t -X gil=1 → 3.14t -X gil=0 |
GIL removal alone | an upper bound on the parallel win |
3.14 → 3.14t -X gil=0 |
both at once | the number your decision actually rests on |
The bottom row is the one your decision rests on — your production service does not run python3.14t -X gil=1. It is also the one you probably cannot measure honestly, because only the middle row compares a binary against itself. Hold that thought; it is what went wrong when I ran this.
The tax got small, and that is the real news
Through 3.13 the honest advice was to stay away: “The free-threaded mode is experimental and work is ongoing to improve it: expect some bugs and a substantial single-threaded performance hit.” 3.14 changed that arithmetic. “The performance penalty on single-threaded code in free-threaded mode is now roughly 5-10%, depending on the platform and C compiler used.” The howto names the spread: “On the pyperformance benchmark suite, the average overhead ranges from about 1% on macOS aarch64 to 8% on x86-64 Linux systems.” That spread is the point: there is no single tax figure to quote, only one for your architecture, compiler and workload.
Alongside that came an optimization the 3.13 free-threaded build ran without: “The specializing adaptive interpreter (PEP 659) is now enabled in free-threaded mode, which along with many other optimizations greatly improves its performance.” The experimental label came off in the same release: “PEP 779: Free-threaded Python is officially supported”. Supported is not default, though — “Phase II would make the free-threaded build officially supported but still optional” — so the build, and the risk, remain your choice.
So the tax is single digits, and whether free-threading wins is a question about your workload rather than about CPython.
A harness that measures the right thing
# bench.py — one script, run once per configuration.
import os
import sys
import sysconfig
import threading
import time


def actual_mode() -> str:
    """Which of the three configurations are we really in?"""
    # Coerce: the config var is set to 1 only on free-threaded builds;
    # treat missing or falsy as the default build.
    free_threaded = int(sysconfig.get_config_var("Py_GIL_DISABLED") or 0) == 1
    if not free_threaded:
        return "gil"
    # getattr guard: the function is a CPython implementation detail, not
    # guaranteed to exist in other Python implementations.
    gil_on = getattr(sys, "_is_gil_enabled", lambda: True)()
    return "ft-gil" if gil_on else "ft-nogil"


def cpu_work(iterations: int) -> int:
    total = 0
    for i in range(iterations):
        total += i * i % 7
    return total


def run(threads: int, total_iterations: int) -> float:
    # Fixed total work, split n ways: this measures scaling, not throughput
    # inflation from simply handing the machine more to do.
    per_thread = total_iterations // threads
    workers = [
        threading.Thread(target=cpu_work, args=(per_thread,))
        for _ in range(threads)
    ]
    start = time.perf_counter()
    for w in workers:
        w.start()
    for w in workers:
        w.join()
    return time.perf_counter() - start


if __name__ == "__main__":
    expected = os.environ["EXPECT"]
    got = actual_mode()
    if got != expected:
        raise SystemExit(f"refusing to benchmark: expected {expected}, running {got}")

    for n in (1, 2, 4, 8):
        print(f"{n:>2} threads  {run(n, 40_000_000):6.2f}s  [{got}]")
Run it once per configuration:
EXPECT=gil      python3.14                bench.py
EXPECT=ft-gil   python3.14t -X gil=1      bench.py
EXPECT=ft-nogil python3.14t -X gil=0      bench.py
Two details in there matter more than the timing loop.
The work is fixed and divided, not multiplied. Give each thread its own full unit and the number climbs as you add threads even when nothing parallelizes — you simply handed the machine more to do. Splitting a constant total is what turns the output into a scaling curve.
The run refuses to start in the wrong mode. sysconfig.get_config_var("Py_GIL_DISABLED") is the documented way to ask about the build — “This is the recommended mechanism for decisions related to the build configuration” — and sys._is_gil_enabled() answers the separate question of what this process is doing right now: “The new sys._is_gil_enabled() function can be used to check whether the GIL is actually disabled in the running process.” Build and runtime state can disagree, so you need both.
What it measured on sixteen cores
Intel Core Ultra 7 265H, Linux x86-64, two runs of the same three commands. The shape arrives before the numbers do:
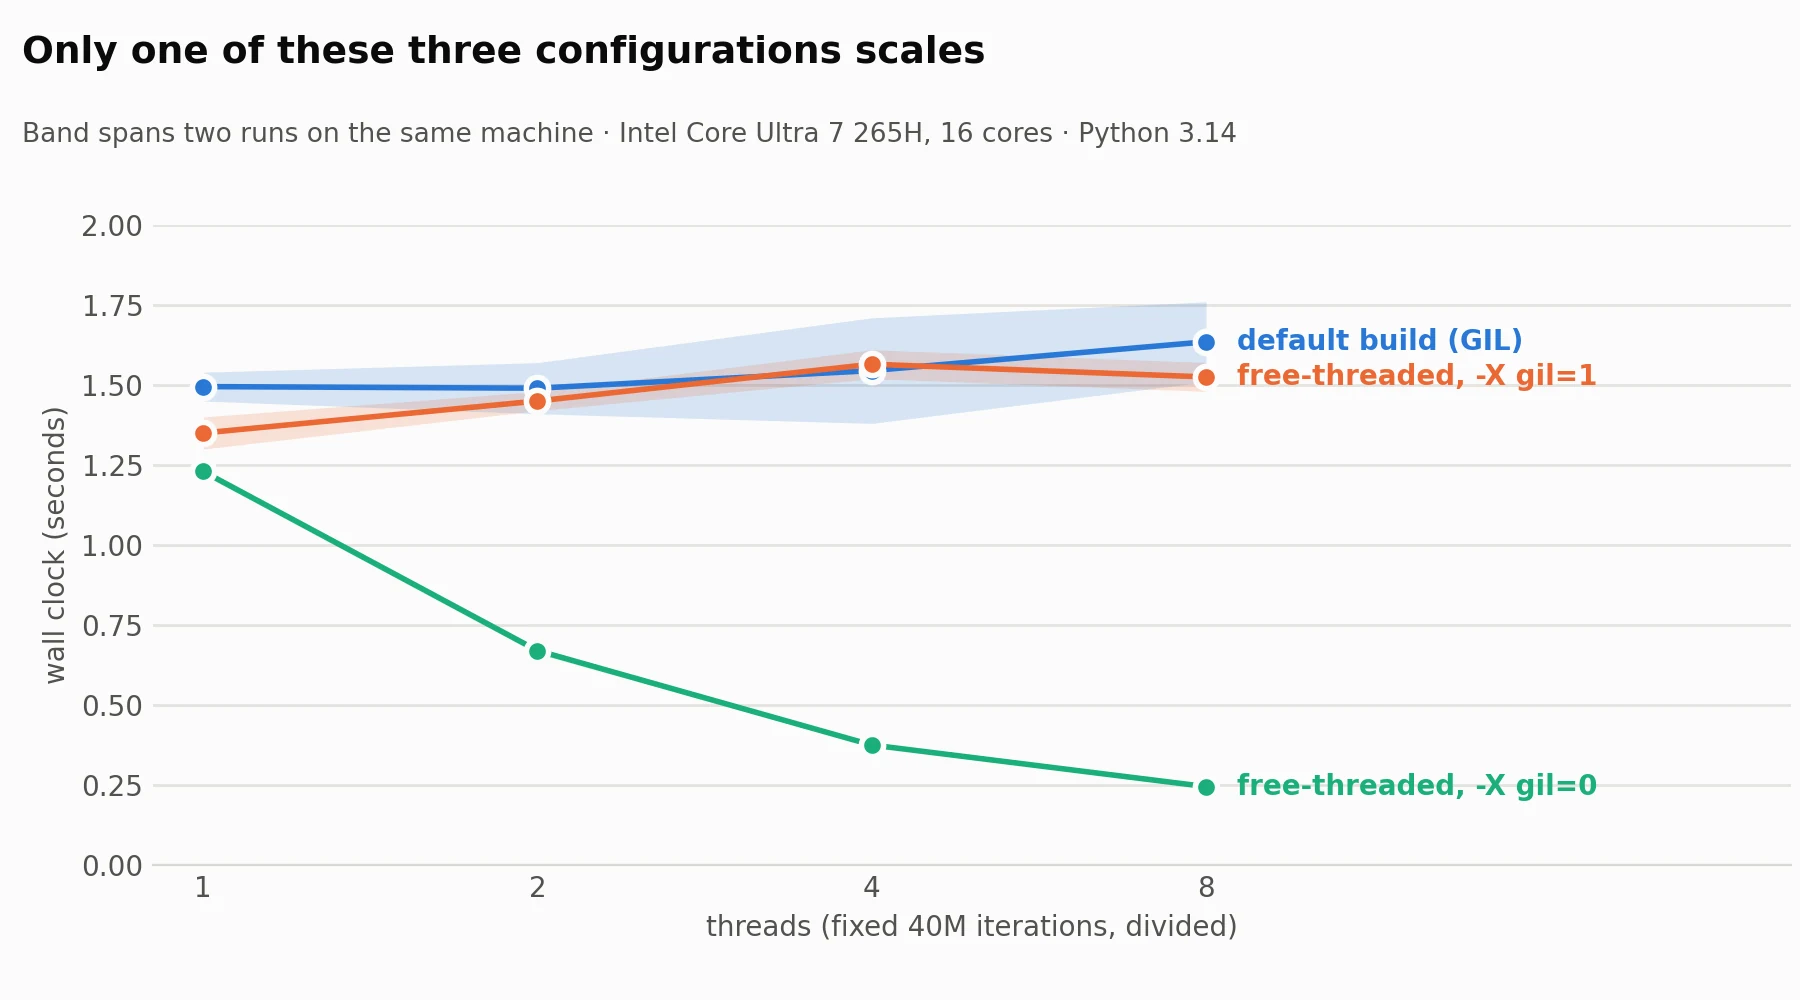
Bands span the two runs:
| threads | gil |
ft-gil |
ft-nogil |
|---|---|---|---|
| 1 | 1.54 / 1.45 | 1.40 / 1.30 | 1.22 / 1.24 |
| 2 | 1.57 / 1.41 | 1.48 / 1.42 | 0.68 / 0.66 |
| 4 | 1.71 / 1.38 | 1.61 / 1.52 | 0.38 / 0.37 |
| 8 | 1.76 / 1.51 | 1.57 / 1.48 | 0.25 / 0.24 |
The parallel win is unmissable and it reproduces. ft-nogil falls from 1.22s to 0.25s in one run and 1.24s to 0.24s in the other — 4.9x and 5.2x on eight threads. Both GIL columns stay flat or drift upward — fixed work split more ways, with only thread overhead to show for it.
Now the part I did not expect. The tax is not in this table, and it cannot be. The gil column swings from 1.71s to 1.38s at four threads between identical runs — a 24% spread, against a documented effect of 5-10%. The noise is three times the signal. The harness has no warmup and no repetition; I wrote it to show scaling and then quietly asked it to resolve something an order of magnitude finer.
The two binaries are not comparable either: 3.14.4 built with GCC against 3.14.7 with Clang. A different patch release and compiler, so whatever separates those columns carries the toolchain along with the GIL.
So this answers exactly one of its three questions honestly: ft-gil against ft-nogil, one binary against itself, one flag apart. The row I called decision-relevant is the one this setup is least able to produce.
The failure that quietly invalidates the whole exercise
The EXPECT check in that harness guards against the likeliest way this measurement goes wrong: the GIL turning itself back on without you noticing.
“The GIL may also automatically be enabled when importing a C-API extension module that is not explicitly marked as supporting free threading. A warning will be printed in this case.” The opt-in belongs to the extension author, not to you, and the docs are blunt that this is common: “Some third-party packages, in particular ones with an extension module, may not be ready for use in a free-threaded build, and will re-enable the GIL.”
A warning on stderr, in a CI log nobody reads, is exactly how a “free-threaded” deployment ends up running with the GIL on for a quarter.
Which means the toy benchmark above measures the wrong process. Your service imports forty transitive dependencies before it reaches anything of yours. Import that graph before checking the mode:
import app.services  # the real import graph, not a synthetic workload

expected = os.environ["EXPECT"]
got = actual_mode()
if got != expected:
    raise SystemExit(f"refusing to benchmark: expected {expected}, running {got}")
If it fires, you have learned more than any timing number would tell you: the dependency that would have silently capped production, months before you shipped.
Parallel is not the same as safe
One last thing a 5.2x will not tell you. The docs describe built-in containers as holding internal locks, then withdraw the guarantee in the same breath — “this should be treated as a description of the current implementation, not a guarantee of current or future behavior.” The recommendation is unambiguous: “It’s recommended to use the threading.Lock or other synchronization primitives instead of relying on the internal locks of built-in types, when possible.”
The GIL never made your code thread-safe. It made a particular class of race narrow enough that a lot of code survived having one. Removing it changes the odds on bugs you already shipped, on paths your test suite only ever runs single-threaded.
What to do with this
Measure the win, not the tax. The win is enormous, obvious in four lines of output, and reproducible on a laptop — run ft-gil against ft-nogil on one binary, with your real dependency graph imported, and you will know in a minute whether your workload parallelizes. The tax is single digits, smaller than the noise in any harness this size, and confounded unless you build both interpreters yourself. Take it from pyperformance.
And if your service is I/O-bound — most services calling themselves CPU-bound are waiting on something — you pay the tax and collect nothing, because threads were already releasing the GIL on every socket read.
The build is supported now. That is a statement about CPython’s readiness, not about yours.
Further reading
- Python support for free threading — the user-facing howto: detection, runtime switches, thread-safety caveats.
- What’s New in Python 3.14 — the official-support announcement and the 5-10% figure.
- What’s New in Python 3.13 — the experimental-mode framing this replaced.
- PEP 779 – Criteria for supported status for free-threaded Python — the numeric targets proposed for supported status.
- C API Extension Support for Free Threading — how an extension opts in, and what happens when it does not.
- Command-line
-X gilandPYTHON_GIL— the exact semantics of the runtime switch. - Running Python with the GIL Disabled — Quansight Labs’ guide; the source for the
t-suffix naming, which the CPython docs do not specify. - Breaking Down Python 3.13’s Experimental Free-Threading Mode — the 3.13-era background this post updates.