In the domain of real-time communication, the concept of “quality” is both paramount and profoundly elusive. For developers and architects of WebRTC applications, the challenge lies in translating a user’s subjective experience—a clear voice, a smooth video feed, a natural conversation—into objective, measurable, and actionable data. The standard WebRTC
getStats() API provides a firehose of raw telemetry, offering over 170 distinct metrics that describe the intricate state of a peer connection. This data, including packet loss percentages, network jitter in milliseconds, and round-trip times, is technically precise but fails to answer the most fundamental question: “How good was the call for the user?” This disconnect between low-level network statistics and high-level user perception creates a significant “observability gap,” leaving development teams with a wealth of data but a poverty of insight.
To bridge this gap, the telecommunications industry has long relied on the Mean Opinion Score (MOS). MOS is a standardized metric that quantifies the perceived quality of audio or video communication, traditionally captured by asking human subjects to rate their experience on a simple five-point scale. This scale provides an intuitive and universally understood measure of quality:
- 5: Excellent
- 4: Good
- 3: Fair
- 2: Poor
- 1: Bad
While this subjective feedback is the gold standard, its collection is impractical and unscalable for the millions of concurrent sessions powered by modern WebRTC platforms. The operational demands of real-time monitoring, automated alerting, and large-scale quality assurance necessitate a different approach: objective, algorithmic estimation. This need has driven the development of computational models that can predict a likely MOS value based on the same measurable network and media parameters available from the
getStats() API.
This shift from subjective testing to objective estimation is not merely a technical convenience; it represents a fundamental operational and business imperative. As WebRTC applications operate at a massive scale, ensuring a consistent Quality of Experience (QoE) is a critical factor for user retention and competitive differentiation. An automated, scalable, and repeatable method for gauging user experience is therefore essential. This has created a clear technical need for specialized libraries capable of translating a complex vector of low-level metrics into a single, high-level, business-relevant Key Performance Indicator (KPI). The
rtcscore project, an open-source JavaScript library, is a direct and powerful response to this industry-wide demand, offering a focused solution for estimating the Mean Opinion Score in real-time communication applications.
Deconstructing rtcscore - Core Architecture and Purpose
The ggarber/rtcscore project is a lightweight, open-source JavaScript library with a singular, well-defined purpose: to estimate the Mean Opinion Score for WebRTC audio and video streams. Primarily written in JavaScript (98.2%), it is designed for straightforward client-side integration into any WebRTC application, providing a simple mechanism to convert raw performance statistics into a meaningful quality score.
A significant indicator of the library’s credibility and the robustness of its underlying models is its adoption and porting by major players in the WebRTC ecosystem. Notably, the project exists as livekit/rtcscore-go, a complete Go implementation maintained by the team behind the popular open-source WebRTC infrastructure project, LiveKit. The existence of this port is a powerful endorsement. LiveKit’s decision to reimplement the library’s logic in Go for server-side use implies that the scoring model is considered sound, reliable, and valuable enough for large-scale, backend quality monitoring. This elevates
rtcscore from a simple client-side utility to a proven, industry-vetted model for quality estimation.
Practical Implementation Guide
The library is designed for ease of use, with a minimal API surface that allows developers to quickly integrate it into their projects.
Installation
rtcscore can be installed as a standard npm package dependency within a project’s toolchain. The installation is executed with a single command 10:
npm install rtcscore
Core API
The library’s design philosophy emphasizes simplicity by exposing a single, straightforward API function: score(). This function accepts one argument: an object containing audio and video properties. These properties, in turn, hold objects with the specific metrics collected from the WebRTC peer connection that are used to calculate the final score.
“Getting Started” Code Example
Integrating rtcscore into an application typically involves periodically calling the getStats() method on an RTCPeerConnection object, extracting the relevant metrics, and passing them to the score() function. The following example demonstrates a typical usage pattern:
import score from "rtcscore";

// This function would be called periodically (e.g., every few seconds)
async function calculateAndUpdateQuality(peerConnection) {
    // Collect the latest stats from the WebRTC Peer Connection
    const statsReport = await peerConnection.getStats();

    // NOTE: The following is a simplified extraction. A production implementation
    // would require parsing the statsReport to find the active candidate pair
    // and the relevant inbound/outbound RTP streams to gather these values.
    const currentStats = {
        audio: {
            packetLoss: 2, // Example: 2% packet loss
            roundTripTime: 120, // Example: 120ms RTT
            bufferDelay: 40, // Example: 40ms jitter buffer delay
        },
        video: {
            bitrate: 500000, // Example: 500 kbps
            packetLoss: 1, // Example: 1% packet loss
            frameRate: 28, // Example: 28 frames per second
            width: 1280,
            height: 720,
            codec: "VP9",
        },
    };

    const qualityScore = score(currentStats);
    console.log(`Current estimated MOS: ${qualityScore.toFixed(2)}`);
    // Example output: Current estimated MOS: 4.12
}
The library’s focused design is one of its key strengths. It deliberately does not handle the complexities of getStats() data collection, parsing, or the aggregation of scores over time. It is a pure calculation engine. This modularity makes it a highly flexible component that can be easily integrated into a larger, custom-built monitoring and analytics strategy, allowing developers to decide how and when to collect data and what to do with the resulting score.
The Science of Scoring - Audio Quality with the Modified E-Model
For audio quality assessment, rtcscore is built upon a solid and well-established foundation: a modified version of the ITU-T G. E-Model. The E-Model is an internationally recognized computational standard developed by the International Telecommunication Union (ITU) for predicting the subjective quality of voice communications. Its purpose is to provide a consistent and repeatable way to plan and assess telecommunication networks by modeling the cumulative impact of various transmission impairments on perceived speech quality.
Conceptually, the E-Model operates by calculating a “Transmission Rating Factor,” commonly known as the R-value, which typically ranges from 0 (worst) to 100 (best). This R-value is derived from a formula that begins with a near-perfect score and systematically subtracts penalties for different types of “impairment factors.” The fundamental E-Model equation is 13:
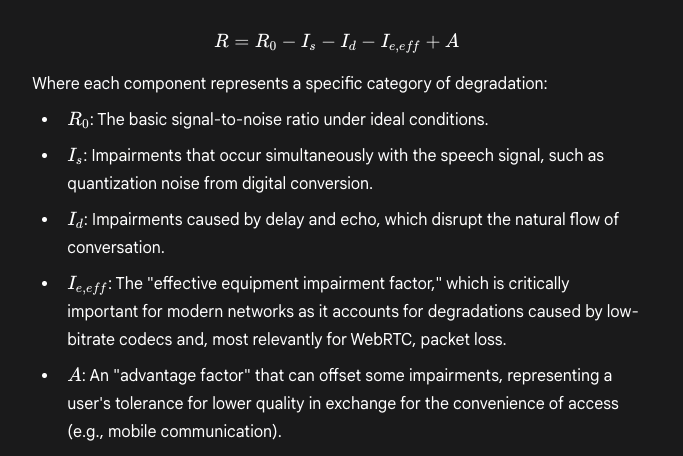
Once the final R-value is calculated, it is mapped to the familiar 1-to-5 MOS scale. The
rtcscore library implements a simplified and adapted version of this model, specifically tailored for the codecs and network characteristics of WebRTC. The key modifications involve accounting for modern wideband codecs like Opus and utilizing input parameters that are readily available from the client-side getStats() API.
This reliance on a public, well-documented international standard lends significant credibility to rtcscore’s audio calculations. Developers can have confidence that the resulting audio score is not an arbitrary value derived from a proprietary “black box” algorithm, but is instead grounded in decades of rigorous telecommunications research. This makes the audio MOS a reliable and defensible metric for use in production monitoring systems.
rtcscore Audio Input Parameters Explained
To produce an accurate audio MOS, the score() function requires a set of specific input parameters. The following table details each parameter, its significance in the context of audio quality, and its impact on the final score.
| Parameter | Type | Description & Significance | Impact on Score |
|---|---|---|---|
| packetLoss | Number (0-100) | Represents the percentage of audio packets that are lost during transmission. This is the single most detrimental factor for audio quality, causing audible glitches, dropouts, and robotic-sounding speech. 10 | A higher value drastically lowers the score. |
| bitrate | Number (bps) | The data rate of the audio stream. A higher bitrate allows for a more faithful representation of the original audio signal, resulting in richer, higher-fidelity sound. 10 | A higher value generally increases the score. This parameter is ignored if dtx is enabled. |
| roundTripTime | Number (ms) | Measures network latency—the time it takes for a packet to travel to the remote peer and back. High RTT leads to noticeable delays in conversation, causing participants to talk over each other and disrupting conversational rhythm. 10 | A higher value lowers the score. |
| bufferDelay | Number (ms) | The delay introduced by the jitter buffer on the receiving end. This buffer is essential for smoothing out variations in packet arrival times (jitter) but adds to the overall latency. 4 | A higher value lowers the score, as it contributes to the total end-to-end delay. |
| fec | Boolean | Indicates whether Opus Forward Error Correction is enabled. FEC is a technique where redundant data is sent, allowing the receiver to reconstruct lost packets without retransmission, which is crucial for low-latency applications. 4 | A true value helps to mitigate the negative impact of a given packetLoss percentage, resulting in a higher score. |
| dtx | Boolean | Indicates whether Opus Discontinuous Transmission is enabled. DTX is a bandwidth-saving feature that only transmits audio packets when the user is speaking. 10 | If true, the bitrate parameter is ignored in the calculation, and a small additional degradation penalty is applied to the score. |
The Art of Scoring - Video Quality with Logarithmic Regression
In stark contrast to its standards-based approach for audio, rtcscore employs a different methodology for video quality estimation. The library utilizes logarithmic regression formulas developed from a “limited collected” set of subjective test data. This empirical, data-driven approach reflects the inherent complexities of objectively modeling video quality, which is a far more multi-dimensional problem than audio.
The challenge stems from the numerous, interdependent factors that influence a user’s perception of video. While audio quality is primarily a function of clarity and delay, video quality is a complex interplay of:
- Spatial Resolution: The clarity and detail, determined by width and height.
- Temporal Resolution: The smoothness of motion, determined by frameRate.
- Bitrate: The amount of data allocated to encode the video, which directly impacts compression artifacts.
- Codec Efficiency: The performance of the compression algorithm used (e.g., VP8, VP9, H.). Modern codecs can deliver significantly better quality at the same bitrate. rtcscore acknowledges this by assuming approximately a 20% improvement in encoding efficiency for VP9 over VP8 and H.4
- Content Type: The nature of the video content itself. A low-bitrate stream may look perfectly acceptable for a static “talking head” presentation but appear severely degraded during a high-motion scene. Algorithmic models typically cannot account for this content dependency.
Logarithmic regression is a statistical method used to find a mathematical curve that best fits a set of observed data points. In this context, the model was likely built by collecting subjective MOS ratings from users for video streams with varying technical parameters (bitrate, frame rate, etc.). The regression analysis then generates a formula that predicts the MOS score based on those input parameters. However, the library’s own documentation highlights the “limited collected data” used to build this model. This important caveat suggests that the video score should be interpreted more as a well-informed heuristic or a relative indicator rather than a precise, standardized measurement on par with the E-Model-based audio score.
This asymmetry between the audio and video models is a critical consideration for developers. While the absolute value of the audio MOS can be treated with a high degree of confidence due to its standards-based foundation, the video MOS is more valuable as a relative metric. It is exceptionally useful for trend analysis (e.g., “Is our average video quality improving over time?”) and A/B testing (e.g., “Did switching to a new codec result in a higher average video score for our users?”).
rtcscore Video Input Parameters Explained
The video scoring model takes into account a wide range of parameters that collectively determine the final quality estimate. The following table provides a detailed reference for each input, explaining its role in the user’s visual experience.
| Parameter | Type | Description & Significance | Impact on Score |
|---|---|---|---|
| packetLoss | Number (0-100) | The percentage of lost video packets. Packet loss in video streams manifests as visual artifacts such as freezing, stuttering, blockiness (macroblocking), or ghosting. | A higher value significantly lowers the score. |
| bitrate | Number (bps) | The data rate of the video stream. Bitrate is the “budget” for encoding the video. A higher bitrate allows for more detail, sharper images, and fewer visible compression artifacts. | A higher value increases the score, though its effect is relative to the resolution and frame rate it must support. |
| roundTripTime | Number (ms) | Network latency. While less disruptive than in audio, high RTT in video can still lead to a noticeable lag between a user’s action and its visual representation, impacting interactivity. | A higher value lowers the score. |
| bufferDelay | Number (ms) | Jitter buffer delay for video. Similar to audio, this helps ensure smooth playback but adds to the overall end-to-end delay. | A higher value lowers the score. |
| codec | String (‘VP8’/’VP9’/’H264’) | The video codec being used. rtcscore recognizes that more modern codecs like VP9 are more efficient, providing better quality for a given bitrate. | ‘VP9’ is treated as approximately 20% more efficient than ‘VP8’ or ‘H264’, resulting in a higher score for the same input parameters. |
| width / height | Number (pixels) | The resolution of the received video frames. Higher resolution provides more detail and a clearer picture, which is a primary component of perceived quality. | Higher values generally contribute to a higher score. |
| expectedWidth / expectedHeight | Number (pixels) | The ideal resolution of the rendering window or display area. This is used to detect and penalize quality degradation caused by upscaling a lower-resolution video to fit a larger area. | If these values do not match the actual width and height, the score is lowered to account for scaling artifacts. |
| frameRate | Number (fps) | The number of frames received per second. A higher frame rate results in smoother, more fluid motion, which is crucial for a natural viewing experience. The model considers that a 5 fps video requires less bitrate than a 30 fps video for the same quality. | A higher value generally increases the score. |
| expectedFrameRate | Number (fps) | The ideal frame rate from the source video, which is typically 30 fps for webcams. A mismatch can indicate network or processing issues causing frame drops. | If the received frameRate is lower than the expectedFrameRate, it can negatively impact the score. |
rtcscore in Context - The WebRTC Quality Monitoring Ecosystem
While rtcscore is a powerful tool for quality estimation, it is essential to understand its place within the broader ecosystem of WebRTC quality monitoring, testing, and observability tools. This landscape can be broadly categorized into several distinct types of solutions, each addressing a different aspect of ensuring high-quality real-time communication.
Category 1: Comprehensive Observability Platforms
This category includes commercial and open-source platforms that provide a full-stack, end-to-end solution for monitoring WebRTC applications. Examples include Operata 6, testRTC 7, and the now open-source Peermetrics. These platforms are not libraries but complete services that typically handle:
- Data Collection: Automatically gathering getStats() and other telemetry from clients.
- Aggregation and Storage: Centralizing data from all user sessions for historical analysis.
- Visualization: Providing dashboards with graphs and timelines to analyze trends and troubleshoot issues.
- Alerting: Proactively notifying developers of quality degradation or connection failures.
In relation to these platforms, rtcscore is best viewed as a potential component or library that could be integrated within such a system to generate the MOS KPI, but it does not replace the need for the platform’s broader data handling and visualization capabilities.
Category 2: Performance and Load Testing Tools
This category is focused on pre-production testing and validation rather than live production monitoring. The leading open-source tool in this space is webrtcperf. Its primary function is to simulate multiple concurrent users connecting to a WebRTC service to measure how the infrastructure performs under stress. It can simulate various network constraints (e.g., limited bandwidth, high packet loss) and collects raw performance statistics to identify bottlenecks and capacity limits. The fundamental difference in purpose is clear:
webrtcperf is designed to answer the question, “Can my server architecture handle 100 simultaneous users?”, whereas rtcscore is designed to answer, “How is the call quality for this one specific user right now?”.
Category 3: Diagnostic and Scoring Libraries
This is the category where rtcscore resides, alongside other open-source libraries designed to be integrated directly into a client application. Its most direct and relevant alternative is webrtc-issue-detector. While both libraries analyze
getStats() data and can calculate a MOS, they are built on fundamentally different philosophies and serve complementary, rather than competing, purposes. rtcscore is a pure scorer, focused on quantifying the overall quality. In contrast, webrtc-issue-detector is a diagnostician, focused on identifying the specific root cause of a quality problem. It includes a suite of dedicated “Detectors” designed to pinpoint issues like encoder CPU throttling, insufficient outbound network throughput, high server-side latency, or frozen video tracks.
The following table provides a detailed comparison of these two libraries, helping developers choose the right tool for their specific needs.
| Feature / Philosophy | rtcscore | webrtc-issue-detector |
|---|---|---|
| Primary Goal | Quantitative Scoring: To provide a single, numeric MOS value representing the overall perceived quality of the stream. | Qualitative Diagnostics: To identify and report the specific root cause of a quality problem, providing actionable insights for troubleshooting. |
| Core Question Answered | “How good is the call quality?” (e.g., a score of 4.2) | “Why is the call quality bad?” (e.g., “outbound-network-throughput” or “encoder-cpu-throttling”) |
| Key Output | A single number between 1 and 5, representing the estimated MOS. | An array of issue objects, each containing a type (e.g., ‘network’, ‘cpu’), a reason for the issue, and a sample of the relevant stats. |
| MOS Calculation | Yes, this is its sole and primary purpose. It uses a modified E-Model for audio and logarithmic regression for video. | Yes, it includes a MOS calculator as one of its features, but this is secondary to its diagnostic capabilities. |
| Root Cause Analysis | No. It provides the final score but offers no insight into which specific factor (e.g., CPU vs. network) caused a degradation. | Yes. This is its core strength, with a suite of dedicated detectors for CPU limitations, inbound/outbound network issues, stream data problems, and even potential server-side issues. 22 |
| Ideal Use Case | Powering real-time UI quality indicators, tracking high-level KPIs for business intelligence, and aggregating post-call analytics. | Triggering specific, contextual user guidance (e.g., “Your CPU is overloaded, try closing other applications”), creating automated alerts for specific failure modes, and enabling deep-dive troubleshooting. |
Conclusion: Integrating Objective Quality Scores into Your WebRTC Application
The rtcscore library presents a simple, powerful, and credible solution to one of the most persistent challenges in WebRTC development: quantifying user-perceived quality. Its primary strength lies in its focused design and its use of a modified version of the industry-standard ITU-T E-Model for its audio scoring, which provides a reliable and defensible quality metric. While its empirical, regression-based video model should be interpreted with more nuance—primarily as a relative indicator for trends and comparisons—it still offers valuable insight into video stream performance. The library’s minimalist API makes it an easily integrable component for any developer seeking to move beyond raw network statistics toward a more holistic understanding of user experience.
For developers and architects, the MOS value generated by rtcscore is not merely a number; it is an actionable piece of data that can be leveraged to build more resilient, user-friendly, and high-performing real-time communication applications. The following are concrete recommendations for integrating this objective quality score into a comprehensive quality assurance strategy:
- Real-Time User Feedback: The most immediate application is to power a dynamic “connection quality” indicator within the application’s user interface. By establishing thresholds (e.g., MOS > 4.0 is green, 3.5-4.0 is yellow, < 3.5 is red), the application can provide users with real-time feedback on their call quality, helping them understand if an issue is local to their environment.
- Automated Alerting and Monitoring: The MOS score should be ingested by your application’s monitoring and alerting infrastructure. Sustained drops in a user’s MOS below a critical threshold can trigger automated alerts for support staff or engineering teams, enabling proactive investigation of potential systemic issues before they result in a flood of user complaints.
- Post-Call Analytics and Business Intelligence: By logging the average or final MOS for every session, organizations can build a rich historical dataset of call quality. This data can be aggregated and segmented to uncover invaluable trends. For instance, analytics can reveal if users in a specific geographic region, on a particular ISP, or using a new version of the application are experiencing degraded quality, providing data-driven insights to guide business and engineering decisions.
- A/B Testing and Infrastructure Validation: The average MOS across a cohort of users serves as a powerful success metric for A/B testing changes to the WebRTC infrastructure. When evaluating the impact of enabling a new video codec, deploying new TURN servers, or adjusting media server configurations, a statistically significant improvement in the average MOS provides clear, objective validation that the change resulted in a better user experience.
Ultimately, rtcscore is an essential tool for answering the critical question, “How good is the quality?”. However, it should be viewed as a vital component within a broader quality strategy. For deep-dive diagnostics aimed at answering “Why is the quality poor?”, it can be effectively paired with a tool like webrtc-issue-detector or integrated into a comprehensive observability platform. By combining quantitative scoring with qualitative diagnostics, development teams can transition from a reactive troubleshooting posture to a proactive model of continuous quality assurance, ensuring their WebRTC applications consistently deliver the best possible experience to their users.
Works cited
- How to calculate MOS? WebRTC for Developers, accessed September 1, 2025,
- Peermetrics WebRTC Analytics Platform Review: Open-Source Monitoring & Debugging, accessed September 1, 2025,
- Understanding Qualify Test Results: Call Quality - LiveVox Help Center, accessed September 1, 2025,
- Demystifying WebRTC Quality: A Deep Dive into the rtcscore Library and MOS Estimation, accessed September 1, 2025,
- Bad Internet connection and how to detect it in a WebRTC call? - Medium, accessed September 1, 2025,
- WebRTC Observability - Operata, accessed September 1, 2025,
- A Comprehensive Guide to Choosing the Right WebRTC Test Tool ., accessed September 1, 2025,
- Releases · ggarber/rtcscore - GitHub, accessed September 1, 2025,
- Gustavo Garcia ggarber - GitHub, accessed September 1, 2025,
- ggarber/rtcscore: JS Library to estimate the Mean Opinion . - GitHub, accessed September 1, 2025,
- livekit/rtcscore-go: Library to calculate Mean Opinion Score(MOS) - GitHub, accessed September 1, 2025,